去年Q3 10月份大盤
突然我來一個神邏輯 !! 經濟衰退, Upwork人力媒介工作的需求不會改變, 你知道Upwork 上面派案工作的種類性質嗎 !? 都是大企業最簡單最低成本工作, 為了省人力成本, 勞工醫療福利成本而委外給Freelancer平台的工作項目, 假如經濟發生衰退, 第一個先砍的項目就是freelancer 工作內容 !!
結過你10月底在UPWK加碼, 剛好家在最高點, 完了下星期一開盤, 讓市場活活殺下去, 帳戶又掉 3%, 退到9月初位置
去年Q3 10月份大盤
突然我來一個神邏輯 !! 經濟衰退, Upwork人力媒介工作的需求不會改變, 你知道Upwork 上面派案工作的種類性質嗎 !? 都是大企業最簡單最低成本工作, 為了省人力成本, 勞工醫療福利成本而委外給Freelancer平台的工作項目, 假如經濟發生衰退, 第一個先砍的項目就是freelancer 工作內容 !!
結過你10月底在UPWK加碼, 剛好家在最高點, 完了下星期一開盤, 讓市場活活殺下去, 帳戶又掉 3%, 退到9月初位置
當初因為看到這篇文章, 這位作者成為我投資的啟蒙老師, 自己一頭栽進投資的大千世界, 他讓我明白以前老一輩( 目前50歲以上) 常說股票會虧錢, 在於他們那個時代沒管道可學習, 也沒有人能教他們如何判斷市場, 作者讓我知道投資思維是建立在一連串合理的假設基礎之上, 本文案例並非我自身投資經驗, 但為了答謝作者, 我將6232仕欽標示海龜1號, 紀念當年跟作者的這段書上巧遇緣分
內容某些地方, 我會以現在2022角度回顧去做註腳, 文章出處請看文末圖片左上角, 書本P223 ~ 226
以下文章轉載自財經部落格 『總幹事耕讀筆記』, 作者黃國華是台灣2000s 時期, 一位法人背景出身的投資客, 專長總經研判, 財務分析
6232仕欽 - 人與市場利多之間, 如何對話
這篇有點枯燥, 鎖定的對象是法人研究員, 稱職的產業研究員需具備挖掘潛力產業的能力, 也必須具有懷疑的精神, 這2個思考領域截然不同, 同時要有活潑興奮的想像力與歇斯底里的檢驗標準, 不是那麼容易。唯有清楚的邏輯推演與深厚的基礎知識, 且一切以數字為依歸, 才能為自己的投資組合趨吉避凶, 達到利潤極大化, 風險最小化效益

以下頁碼是指中文版
P15
Yahoo遵循過去的傳統, 早在掛牌上市前就已經獲利, 也從私人融資管道目到充裕的資金, 創辦人楊致遠和費洛各自保有15%股權, 水杉創投擁有17 %, 軟體銀行擁有37%股權
Amazon卻選擇發行垃圾債券以及可轉換公司債來度過難關, 而不願上市釋出更多的股份
從1997~ 2000年底, Amazon籌集了28億美元資金, 但是到2001年亞馬遜股價下跌了86 %, 每年利息負擔高達1億3千萬美元, 當時超過一半的顧客上網訂購一次Amazon的商品之後就再也不曾光顧, 雷曼兄弟的分析師預估Amazon將在2001年底之前耗盡營運資本 他們有3億8千600萬美園的淨營運資本, 和20億美元的負債, 預估2001年將會出現4億4千萬美園的現金缺口
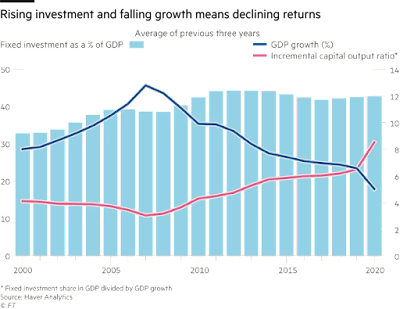
Economists had expected a house-price bloodbath. In March 2022, when the Federal Reserve first started raising interest rates to combat resurgent inflation, the average value of a house in a rich country was 41% higher than five years earlier. Prices had bounced back from the financial crisis of 2007-09, then rocketed during the covid-19 pandemic (see chart). 目前2023房價比2017年還要高41%, 2017年當時房價已經恢復08金融風暴前水準
Global house prices have certainly come off the boil. They are 3% below their recent peak, or 8-10% lower once adjusted for inflation. This is in line with the average correction since the late 19th century. Yet this slump should have been different because it followed a boom when prices rose at their fastest rate of all time. The upshot is that real house prices remain miles above the level of 2019. Many millennials and Gen-Zers, who had dreamt that a crash would allow them to buy their first house, are no doubt disappointed. 許多千禧世代和Z世代, 都希望目前房價回檔一些, 好買進他們人生中第一棟房子 ( 暗示全美購屋需求未來一直都存在)
By
contrast with previous housing slumps, there is no hint that lower house prices
have created financial contagion. Banks do not seem worried about a surge in
bad mortgages. They have fewer risky loans and have not binged on dodgy
subprime securities. In New Zealand mortgage arrears have risen, but remain
below their pre-pandemic norm. In America delinquencies on single-family
mortgages recently hit a post-financial-crisis low. In Canada the share of
mortgages in arrears is close to an all-time low.
Nor
do property woes appear to be throttling the wider economy. Weaker housing
investment is dragging on economic growth, but the effect is small. In previous
housing busts the number of builders declined sharply long before the rest of
the labour market weakened. Yet today there is still red-hot demand for them.
In South Korea construction employment has dropped slightly from its pandemic
highs but now seems to be growing again. In America it is rising by 2.5% a
year, in line with the long-run average. In New Zealand construction vacancies
remain well above historical levels.
Three
factors explain the rich world’s surprising housing resilience: migration,
household finances, and people’s preferences. Take migration first, which is
breaking records across the rich world. In Australia net migration is running
at twice pre-pandemic levels, while in Canada it is double the previous high.
Demand from the new arrivals is supporting the market. Research suggests that
every 100,000 net migrants to Australia raise house prices by 1%. In London,
the first port of call for many new arrivals to Britain, rents for new lets
rose by 16% last year.
Strong
household finances, the second factor, also play a role. Richer folk drove the
housing boom, with post-crisis mortgage regulations shutting out less
creditworthy buyers. In America in 2007 the median mortgagor had a credit score
of around 700 (halfway decent), but in 2021 it was close to 800 (pretty good).
Wealthier households can more easily absorb higher mortgage payments. But many
borrowers will also have locked in past low interest rates. From 2011 to 2021
the share of mortgages across the eu on variable rates fell from close to 40%
to less than 15%. Even as rates have risen, the average ratio of debt-service
payments to income across the rich world remains lower than its pre-pandemic
norm. As a result fewer households have had to downsize, or sell up, than
during previous slumps.
The
pandemic itself has played a role. In 2020-21 many households drastically cut
back on consumption, leading to the accumulation of large “excess savings”
worth many trillions of dollars. This stash of savings has also cushioned
families from higher interest rates. Analysis by Goldman Sachs suggests a
positive correlation across countries between the stock of excess savings and
resilience in house prices. Canadians accumulated vast savings during the
pandemic; home prices there have recently stabilised. Swedes amassed smaller
war chests, and their housing market is a lot weaker.
The
third factor relates to people’s preferences. Research published by the Bank of
England suggests that shifts in people’s wants—such as the desire for a home
office, or a house rather than a flat—explained half of the growth in British
house prices during the pandemic. In many countries, including Australia, the
average household size has shrunk, suggesting that people are less willing to
house-share. And at a time of higher inflation, many people may want to invest
in physical assets, such as property, infrastructure and farmland, that better
hold their value in real terms. All this could mean that housing demand will
remain higher than it was before the pandemic, limiting the potential fall in
prices.


Why non-transitory recession is coming and how to face it as an investor
Vitaliy N.
Katsenelson NOVEMBER 10, 2022
I am not an
economist, but, looking at this picture, it is hard to see how we can avoid a
recession. Ironically, we’ve been in a recession most of
2022 – real GDP declined in the first and second quarters.
Economists attributed declining GDP to a “transitory” recession
caused by an overhang of pandemic-induced supply chain issues.
As
inflationary pressures squeeze consumers from all directions, they simply will
not be able to buy as many widgets as they bought the year before. Demand for
widgets will decline; companies will have to readjust their workforce to the
realities of new demand and thus reduce their employee headcount; and this will
lead to higher unemployment. All this, in turn, will lead to lower demand, and
voila, we’ll find ourselves in a non-transitory recession.

https://twitter.com/arindube/status/1611364452011769856?s=20&t=RRUZcgZuop8GcvDfbz16bQ
With consumption of services in September
just 8 % below pre-pandemic level. The combination of rising spending on
services, spurred by pent-up demand and strong household finances, and firms
facing challenges in increasing hiring has meant upward pressure on wages and
prices.
four out of five American workers in the
private sector are employed in the service economy. Early in 2020, employment
in the services sector fell 17 percent, while employment in the goods sector
fell only modestly less, by 12 percent. And employment has only just recovered
to pre-pandemic levels in recent months
To be sure, the decline in services employment was far larger than in the goods sector,
For decades the service sector has driven the economy and the recent rebound in the service sector continues to drive economic growth
50 percent of small business owners reported difficulties in filling job openings, roughly 20 percentage points above the historical average (Dunkelberg and Wade 2022). Firms’ difficulty hiring workers is likely to slow down the recovery of service-sector businesses, which are relatively labor intensive.
Many small businesses also reported
difficulties with the availability of supplies or inputs. This was particularly
true for small businesses in manufacturing, construction, and retail, with
roughly 50 percent of businesses in each industry reporting trouble with
supplies and inputs in the Pulse Survey
Zoltan Pozsar:(瑞士信貸分析師)
我們需要經濟衰退來遏制通貨膨脹
按:
在下根據這位分析師多篇文章與訪問稿進行翻譯與整理,盡可能把他的意思在一篇文章表達清楚。他的觀點與市場共識明顯有距離,但是卻令我深深佩服。
如果他的觀點是對的,今年剩下來的時間對於股市投資人將是一輩子難忘的痛苦回憶。沒有別的意思,就是請大家小心。
文章請自己看,我想講的,都在裡面了,雖然字句全部是這位分析師的。
==============
瑞士信貸(Credit Suisse)分析師Zoltan Pozsar說,當前的經濟形勢不僅僅是一個被財政政策制約的經濟。因此,不應該將不斷高漲的通貨膨脹視為單純的經濟問題,甚至不應理所當然認為有現成的解決方案(比方說誘導一個經濟衰退)來解決。
“歡迎來到戰爭經濟...國家領袖的決定比中央銀行行長更重要”,Pozsar 這麼認為。


Client's letter as of July 19 2022
My workings in response to client

Hi ~ Bob
From mid-May market give a rebond for breath, roll a few days and disappointedlly start fallen again at 9th June
This pic is chart of S&P 500 Index, roughly the range of 4,107 ~ 4,175 will be a pressure-zone for market climbling in coming month till early September
On 13 June, it suffered a 5% market slump one night, many investor's money is gone at that price ( some people are sold-off, some not sold and keep the position like yours and mine )
1.Let's take a closer look into why the market slump during 9 th ~10 th June, I think the main reason is that at 10th June US Bureau of labor statistics released a number as following :
Table A-1. Real earnings for all employees on private nonfarm payrolls, seasonally adjusted

Sharing his analysis of economic cycles, Dalio explains that, typically, a recessionary cycle leads to a lot of stimulation by central banks, resulting in an economic expansion that is followed by inflation. The price spike is then followed by tighter monetary policy that leads to a recession, and then the cycle repeats again. On average, the cycle lasts about seven years, but the length of them is determined by how much debt and money creation there is and how much slack capacity there is before production constraints are hit.
3. Turn to the Bond market, the 10 years - 3 months Treasury spread shrink down recently, which indicate that many investors sold-out stock position and put money into US Treasury for better protection,
It imply that recently market's postive performance seems a rebond only, it lacks of constantly cash flow into as momentum for next moves-up, this statement can be strengthened by recently market news :
BofA Sees Risk of ‘Proper Capitulation’ If Earnings Disappoint
In the week
through July 13, global equity funds had outflows of $2.9 billion, with US
stocks seeing their first redemptions in three weeks at $1.6 billion, according
to the BofA strategists’ note, citing EPFR Global data.
Global bonds attracted $1.6 billion, while $15.1 billion flowed into cash

59:00 Financial builder got little bit tired, need to take a breath for energy back
50:00 ~ 1:15:00 是本估值影片精華, 計算Sales revenue growth 參考Mogan Stanley, Cowen 和一般華爾街標準, 區分保守-中性-樂觀
不同假設
1:02:00 計算EBIT margin, 由於預估AWS未來3-5年持續營收增長, 作者翻開財報細看Operating income , 逐步分析US market, International和 AWS 佔比
1: 37 : 00 calculate present value of time , Time period input 0.5 - 1.5 - 2.5 - 3.5
It's quite accurate way of doing present value calculation.
還有日期天數算法, 2022/6/12 ~ 2022/12/31 總共幾天, excel 加減符號計算出來
OFFSET Function in Excel: How to Use Offset Function in Excel
Excel OFFSET Function for Dynamic Calculations - Explained in Simple Steps
55 :00 OFFSET( Reference, rows, columns, hight, width )

1:02:00 calculate growth rate of EBIT based on Conservative, street, Optimistic case
formula M50 + (N51-M51)


Cash flow items reference in numbers after 2022 all applied from 資料庫 Factset
1:23:10 EBIAT下面的 CaPEX 預設前三年 2022-2023-2024 Conservative case數值, 作者以Base case 前三年數值2022-2023-2024加上 0.5% 做預設, 同樣的, 預設前三年 2022-2023-2024 Optimistic case數值, 作者以Base case 前三年數值2022-2023-2024 減少 0.5% 做預設
Snowflake vs. Databricks: Conclusion
Snowflake and Databricks are both excellent data platforms for analysis purposes. Each has its pros and cons. Choosing the best platform for your business comes down to usage patterns, data volumes, workloads, and data strategies.
Snowflake is more suited for standard data transformation and analysis and for those users familiar with SQL. Databricks is more suited to streaming, ML, AI, and data science workloads courtesy of its Spark engine which enables use of multiple languages. Snowflake has been playing catchup on languages and recently added support for Python, Java, and Scala.
Some say Snowflake is better for interactive queries as it optimizes storage at the time of ingestion. It also excels at handling BI workloads, and the production of reports and dashboards. As a data warehouse, it offers good performance. Some users note, though, that it struggles when faced with huge data volumes as would be found with streaming workloads. On a straight competition on data warehousing capabilities, Snowflake wins.
But Databricks isn’t really a data warehouse at all. Its data platform is wider in scope with better capabilities than Snowflake for ELT, data science, and machine learning. Users store data in managed object storage of their choice and doesn’t get involved in its pricing. It focuses on the data lake and data processing. But it is squarely aimed at data scientists and highly capable analysts.
In summary, Databricks wins for a technical audience. Snowflake is highly accessible to technical and less technical user base. Databricks provides pretty much every data management feature offered by Snowflake and a lot more besides. But it isn’t easy to use, has a steep learning curve, and requires more maintenance. But it can address a much wider set of data workloads and languages. And those familiar with Apache Spark will tend to gravitate towards Databricks.
Snowflake is better set up for users that want to deploy a good data warehouse and analytics tool rapidly without bogging down in configurations, data science minutia, or manual setup. And this isn’t to say, either, that Snowflake is a light tool or for beginners. Far from it. But it isn’t high-end like Databricks, which is aimed more at complex data engineering, ETL, data science, and streaming workloads. Snowflake, in contrast, is a warehouse to store production data for analytics purposes. And it is good for beginners, too, and for those that want to start small and scale up gradually.
Pricing comes into the selection picture, of course. Sometimes Databricks will be much cheaper due to the way it allows users to take care of their own storage. But not always. Sometimes Snowflake will pan out cheaper.
PayPal, eBay to stay interdependent for 5 years after split

 |
| 木偶說謊 鼻子變長, 你這次空原油就是這樣.... |
操作靈感緣起
6/25 翻開WTI crude oil 52 week moving average線, 價位快要跌破半年支撐100塊, 計畫 short oil.
操作策略 :
剛開始多空部位都建立( 怕近期油價反彈)
情況一 : 在100塊附近止跌, 隨即反彈110 ~ 115 , 你曾經想像空頭100%部位, 多頭50%部位, 假如油開始反彈 103 ~ 105 ~ 110塊, 你可以忍受空頭部位損失 ( 放屁啦 !! 👺👺 7/8 油期貨漲5%, SCO跌10%, 那天晚上你馬上後悔不該放掉50% bull position oil ) 等到oil price 漲超過110便開始衰竭無法漲, 你再 110 ~ 115附近開始加大放空, 加碼SCO, 看似完美計畫 ~
情況二 : 油在100塊附近徘徊1~2星期, 之後經濟數據公佈不如預期, 油直接摜破100, 跌到95塊加碼50% SCO, 跌到90塊 UCO先賣50%, 再跌到85塊, 再賣UCO50%. 假如跌到80塊先賣SCO50%, 繼續跌繼續賣掉剩下SCO部位, 交易結束 ( 跌破90塊後, 中間過程有反彈回漲, 看心理承受度適時買回UCO )
6/30 先分別建立SCO和 UCO 多空部位, 兩者金額一樣(部位Size差不多)
7/7 WTI crude oil盤中跌破100, UCO賣掉50%部位
7/8 油期貨漲了5.8%, 我的SCO跌10%, UCO漲10%問題部位昨天賣掉一半, 結果現在帳戶損失200塊, 心情受到影響( 因為自己想把帳戶損失控制在10%以內, 這次油再操作不利, 損失超過10% )
這樣好了, 假如明晚油再漲, UCO漲超到2.5%就回補50%部位, stop limit價格設明天開盤 +2.5%, , 鎖住損失.
8/6 等了一個月, 油終於殺破90塊
8/8 油反彈超過90, UCO 回補一半

8/22 油再度反彈超過90, UCO 1/3賣掉
8/22 ~ 8/30 油從90塊漲到98塊, 一度有反攻100塊以上之勢, SCO部位一度虧損, 心裡一橫 !! 咬著牙告訴自己, 就算原油反彈至120塊以上, 我就死抱不賣, 抱到明年很有可能再跌下來, 不賺不賠出場
9/7 皇天不負苦心人, 油短短2天從90殺到82塊, SCO 部位 + 16.9% 結清出場, 堪稱今年最成功一筆空單
判斷通膨是否惡化

