2022年7月27日 星期三

China consumer discretionary market


Source from Economists
It is hard to imagine China could ever run shortage of this fuel. But in recent months, the black have been not quite immense enough. A scarcity of coal, which accounts for almost two-thirds of China’s electricity generation, has contributed to the worst power cuts in a decade. And the blackouts have, in turn, hurt growth. “Our economy is developing very fast,” Mr Burtynsky’s host tells him, so as to excuse the gloom and dirt in the air. But that is not quite true any more either.
Comment : The inflation derived from upstream of industry, it indeed inevitably make the inflationed factor transferred from supply side to buy side ( downstream) level by level, which the price is reflectively conveyed to end-user and ultimately push CPI index at higher level
But There is one question, How long does the entirely process of price-transfering to take ?? I mean the price-up launched with Commodity at Sep 2020, in the mid it goes through manufacturing, Utility, Technology, Real state, finally reach downstream of consumer - spending sector, how long it would take ! !
When inflation surge to the degree that out of control, on What date Fed lift up rate in emergency ??   At what date it will truly happened ? How long it takes ?
6 months ~ 1 year ~ 2 year or 5 years after China communists party have fallen down and being taken over by someone... 
If the Super Inflation will come tomorrow, it will make you nervous without any further thinking, But if it will slowly move forward and take several seasons evenly accumulated for many years so that finally reveal on the stage, what do you think of the stock market now is correctly reflect our expectation on fundamentals or overly scary in psychological sense !   make a bet ~ Alex !  make a bet !
When supply is tight, prices are supposed to rise, obliging customers to economise on their consumption. But as the price of coal shot up, power stations were unable to pass their higher costs on. The amount they could charge the grid company that buys the bulk of their power could rise only up to 10% above a regulated price, which was changed infrequently. And the tariff paid by end-users was based on a catalogue of prices that was similarly inflexible. Some power stations simply stopped operating, refusing to generate at a loss.
Despite dramatic jumps in renewable energy output, the global economy remains hooked on coal for electricity. In Asia, coal's share of the generation mix is twice the global average - especially in surging economies such as India. In 2020, more than 35% of the world's power came from coal, according to the BP Statistical Review of World Energy. Roughly 25% came from natural gas, 16% from hydro dams, 10% from nuclear and 12% from renewables like solar and wind.

Consider the energy crunch first. The causes of the coal shortage fall into two categories: structural and incidental. The unlucky contingencies include floods in Henan province in July and in Shanxi this month, which forced some mines to close. In addition, in Inner Mongolia, which accounts for about a quarter of China’s coal output, an investigation into corruption has implicated and hamstrung some of the officials who might previously have approved expansions in coal mining. Shaanxi province, China’s third-largest producer of coal, slowed production to keep the skies clear for a national athletics event in September, which President Xi Jinping attended. And coal expansion has also been inhibited by safety inspectors, who have scrutinised 976 mines, after more than 100 industrial accidents nationwide last year.

The deeper reason for the coal crunch is China’s efforts to reduce its dependence on the fuel, which is responsible for a big share of the country’s carbon emissions. The authorities have been reluctant to approve new mines or the expansion of existing ones in recent years, because “it’s clearly driving the bus in the wrong direction”, says David Fishman of The Lantau Group, an energy consultancy.

I suggest  to leave money in China market, which here are the several reason to why :

1.The China households income climbed up steadily in past 10 years,  which place a solid ground for fostering consumer discretionary industry  and I believe it has further potential to keep going ( Later we'll see the saving rate to household income)


  1. If inflationary issues officially debute in market, recent the power restriction just make huge concerns over left-up production cost of majority of factory, it's not necessarily the bad news for  China macroeconomy. Based on finance theory, moderate inflation can ease the pressure from China local government debts, to extend the timing of debt default, It not seems like an illusion show, but also a trick that many countries' authority like to play in front of domestic audiences.
 
        Let's take an example, today now the Consumer price index base is 100, Shanghai Municipal People's Government  have 10 millon RMB debt due to 31 Dec 2021, and if we wait till end of 2021 year, Consumer price index base is 110, increase 10%, The Shanghai government collect more 10% tax revenue, and principal amounts of local debt still 10 millon RMB, not any changes, with increasing 10% tax revenue, it's more likely to cover the due paid of 10 million local debts


3. With more China young generation enter  the workplace,  the saving rate possibly to be lowered down below 40% from  44%


Before we talk about it, Let's review a classical economics equation :
a Country GDP = Consumption + Invesment + Government spending + exports - imports
Consumption we have stated at point.1 earlier in the text
1 .)For items of Investment, means personal durable good/ enterprise CAPX investment,  to extract it further in details, Business school lecture books usually written in this way investment = Savings
In such case, Savings refer to the salary less living expense , insurance paid, car and house mortgage paid, the rest money to be deposited in personal bank account. and the deposited money used as fund for personal credit loan applied or for financial demand of enterprise's capital investment
2.) Now America value are still prevailing in every corner of the world, its way of life that pursuing individual achievements, with the successful job promotion, bring equivalents standard of physical living for themselves. Now such life value had been more and more spread and rooted into youngs of China, they would work hard and manage self-job career to demonstrate personal character. They don't really appreciate the past way of parents trait - working hard and save money as possible and devoting whole life to their children. Instead They will treat themself much more better, enjoy a gourmet with friends in well-designed restaurant monthly, buying some clothing and decorates in Boutique when off- work, doing  traveling quarterly if affordable, These all are the furnishing soils for future China consumer industry to foster. If you little doubt that, why not take an observation on Nike. Inc this company their China business  because the Fitness trend is all around  developed countries, soon will be imitated and repeat in China as well
Let's see whether Nike's China sales grow 10-15% annualy in next decades, it's the best proof for consumption-orientated  business constantly being stirred in China society, isn't it !
Back to the point of the Economic equation  Invetment = Savings, Based on the social changes of China, youngs tend to choose a living with much more likely America's. I predict the Saving rate would keep falling down and the money would gradually transfer to items of Consumption year by year


My investment idea have been resonated with an article  written by Martin Wolf, this guy of Economics  sphere is a big one, please read as following

The economic threats from China’s real estate bubble by Martin Wolf

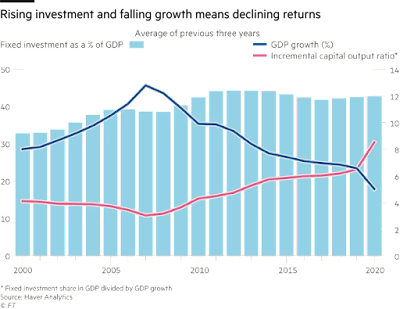
 From the macroeconomic point of view, the most important fact about the Chinese economy is its extraordinary savings. In 2010, gross national savings reached 50 per cent of gross domestic product. Since then, it has fallen a little. But it was still 44 per cent of GDP in 2019. While household savings are extremely high, averaging 38 per cent of disposable incomes between 2010 and 2019, they account for slightly less than half of all these savings. The rest consist mainly of corporate retained earnings. Investment plus net exports have to match savings when the economy is operating close to potential output, if it is not to fall into a slump. Since the global financial crisis, net exports have been a small share of GDP: the world would not accept any more. Total fixed investment duly averaged about 43 per cent of GDP from 2010 to 2019. Surprisingly, this was 5 percentage points higher than between 2000 and 2010. Meanwhile, growth fell significantly. This combination of higher investment with lower growth indicates a big fall in the returns on investment (shown directly in a rising “incremental capital output ratio”). (See charts.)


Yet there are even bigger problems than this suggests. One is that the high investment is associated with huge increases in debt, especially of households and the non-financial corporate sector: the former jumped from 26 to 61 % of GDP between the first quarters of 2010 and 2021 and the latter from 118 to 159 %. Another is that a substantial part of this investment has been wasted. Xi Jinping himself has spoken of the need to shift “to pursuing genuine rather than inflated GDP growth”. This has to be a big part of what he meant. This combination of high and unproductive investment with soaring debt is closely related to the size and rapid growth of the property sector. A 2020 paper by Kenneth Rogoff and Yuanchen Yang argues that China’s property sector contributed 29 % of GDP in 2016. Among high-income economies, only pre-2009 Spain matched this level. Moreover, almost 80 percent of this impact came from investment, while about a third of China’s exceptionally high investment has been in property.


Between 2012 and 2019, investment contributed 40% of China’s growth in demand. If investment in property fell sharply, it would leave a huge shortfall. Yet tolerating this painful adjustment would ultimately be desirable. It should improve the welfare of the population: after all, building unneeded properties is a waste of resources. Slowing the recent pace of property investment would also be a natural consequence of the “three red lines” for property developers imposed by the state last year: hard limits on a company’s debt-to-asset ratio, its debt-to-equity ratio and its cash-to-short-term-debt ratio. The main policy now should be to shift spending towards consumption, and away from the most wasteful investment. This would require redistribution of income towards households, especially poorer households, as well as a rise in public consumption. Such a shift would also fit with the recent attack on the privileges of great wealth. It would also require big reforms, notably in taxation and the structure of public spending. In addition, investors should be shifted away from property toward the transition away from high carbon emissions. That too would require big policy changes.
Crises are also opportunities. The Chinese government is well aware that the great investment boom in property has gone far beyond reasonable limits. The economy needs different drivers of demand. Since the country is still relatively poor, a prolonged economic slowdown, such as Japan’s, is unnecessary, especially when one considers the room for improved quality of growth. But the model based on wasteful investment has reached its end. It must be replaced.


Market forecast to 2021 ( writings in letter reply to client )


Client's letter as of  Mar 17 2021

Dear York,

I hope you had a good week in Taiwan and back to work regularly without too much stress.

In regards to the annual work for investments, I was just checking the message that you sent me. Considering the very unstable market conditions that we are now, perhaps we might need a little bit of help to review the investment allocation from Pacific insurance. Brian seems very busy during these weeks so he is not replying much and also I would like to have your opinion on how to further proceed with investements.

Please let me know what you think.

With My Best Regards

Bob


My workings in reponse


Hi ~ Bob
Firstly, please look at the 3 piece of images,  separately New order of Durable goods - Machinery- Electronic goods, which represent the obvious strength back up U.S economic growth in future 1-2 years . It's very clearly that demand for Durable and Machinery act as "V" pattern as evidence of economy reactivated from Mar 2020 collapse


And the demand for Electronic products ( pic3 below) also slowly climb up from 2016 likely to be medium-long term view Computer and electronic products associated with broad variety of components, related to Asia China- Taiwan- Koera supply chain, It's rising demand can bring up the utilization of relevant industry and even indirectly keep the vitality to U.S SaaS economy


When Market cycle head into second-half of 2021, the base level of substantial goods have been left up to relatively high, the further consumption for durable goods could be limited, at the meanwhile, with widely Vaccine shot to help to unlock U.S service industry ( entertainment, dining, ) It would boost lots of demand for service to  many aspects of living, that take over the Manufacturer sector as the engine to subsequently power US economy ( please remember service sector amounted to 70% US GDP)


But there is still a risk hidden there, If the coming of service activities not strong enough to bring more fire to business activities, on the other hand, the inventory unsold left in warehouse that formely made by manufacturing sector would start to make economy slightly backward for over 6 months ( De-stocking period and stock - clearance) inevitably lead to another crash on stock market.


A comments on investment target in 2021
1.Commodity - Latin America fund
Actually the USD is technically lying in the flat ground in coming 1-2 years ( it's possible not depreciationed anymore) and the expectation of inflation would start to make commodity price to be speculated-up in future1-2 years from now.


2.The emerging market 
Short- term investment and only 10% money into for the price too high
Before USD officially strengthen enough to turn back the position as 2016's, the emerging market Africa, India, South east Asia, middle east even the Turkey( I like this one) still would be the first choice for foreign capital in 2021-2022


3. China 
when market goes down adding 10% money. We have discuss several times on this country, though this broad nation notorious for bribery, riding on someone's coattails, inefficiency of business operation, but their common people consumption still have room to grow and many of big China company are transforming into corporation with matured business, which have stable inland market to run and manage, they are not necessarily to aggresively settle Europe-US market to compete with many big company like google, Philiphs, Honeywell, P&G. They only to take care well of 1.3 trillion population That's enough for them to grow. Thus, you don't have to look down on China value fund, keep at least 10% -20% on it, and you're very possibly got average 8% -10% after 5 years by China value.


4. Singapore - Koera - USA
Singapore surely your first choice now, but little sorry for not any fund the 100% purly targeted to the country on Pacific fundlist. Koera is an attractive one but now price little high. USA still might be a choice if above all selected targets unqualified for your preference ! especially when USD dollars start to recover its old glory, it' will attract more capital choose to transfer money back to USA.


OK ~ if any question, let's leave to weekends for talks


Best Regards
York

2022年7月21日 星期四

Market forecast to 2022 second year


Client's letter as of July 19 2022

Hi York,
How are you doing in Taiwan? I sincerely hope all is well for yourself and your wife.

Another point, this is a good time for me to review the status of investments and make further decisions. I wonder if you are available for a phone call one day this week so we can discuss the details of the investments. I would like to know your opinion about some investments that i want to do during this period of time.
Kindly let me know and thank you in advance

With My Best Regards

Bob
MBA


My workings in response to client


Hi ~ Bob

From mid-May market give a rebond for breath, roll a few days and disappointedlly start fallen again at 9th June  

This pic is chart of S&P 500 Index, roughly the range of 4,107 ~ 4,175  will be a pressure-zone for market climbling in coming  month till early September 

On 13 June, it suffered a 5% market slump one night, many investor's money is gone at that price ( some people are sold-off, some not sold and keep the position like yours and mine )  


1.Let's take a closer look into why the market slump during 9 th ~10 th June, I think the main reason is that at 10th June US Bureau of labor statistics released a number as following :

Table A-1. Real earnings for all employees on private nonfarm payrolls, seasonally adjusted


Labor real hourly earnings from April - May - June, separately 11.04 - 10.97 - 10.86, fantastically goes for sequential 3 months decline. Labor real hourly earnings means that employee get less and less job paid after inflation adjusted. Would it like to be a devastating cut on Personal consumer expenditure till the end 2022 !? Who knows ~ 


2. There's a good point regard to now US supply chain of manufacturer described by Master Ray. Dalio as following :

Sharing his analysis of economic cycles, Dalio explains that, typically, a recessionary cycle leads to a lot of stimulation by central banks, resulting in an economic expansion that is followed by inflation. The price spike is then followed by tighter monetary policy that leads to a recession, and then the cycle repeats again. On average, the cycle lasts about seven years, but the length of them is determined by how much debt and money creation there is and how much slack capacity there is before production constraints are hit.


3. Turn to the Bond market, the 10 years - 3 months Treasury spread shrink down recently, which indicate that  many investors sold-out stock position and put money into US Treasury for better protection,

It imply that recently market's postive performance seems a rebond only, it lacks of constantly cash flow into as momentum for next moves-up, this statement can be strengthened by recently market news : 

BofA Sees Risk of ‘Proper Capitulation’ If Earnings Disappoint

In the week through July 13, global equity funds had outflows of $2.9 billion, with US stocks seeing their first redemptions in three weeks at $1.6 billion, according to the BofA strategists note, citing EPFR Global data. Global bonds attracted $1.6 billion, while $15.1 billion flowed into cash


Finally make a conclusion in short :
If you're appeal to the recent market-up and want to invest little money to make yourself a rush-in, you can go for it ~ and remember whatever it takes, you need to carry on till the end year Christmas, because you are already in


I think the most likellyhood the pattern market present ahead of us in 3 ~ 6 months, not super up or sppokkey slump, it would continue to be bumpy in a range of  3900 ~ 4300 S&P500 Index.


2022年7月20日 星期三

Amazon Financial modelng : quick note


59:00  Financial builder got little bit tired, need to take a breath for energy back 


50:00 ~ 1:15:00 是本估值影片精華,  計算Sales revenue growth 參考Mogan Stanley, Cowen 和一般華爾街標準, 區分保守-中性-樂觀

不同假設


1:02:00 計算EBIT margin, 由於預估AWS未來3-5年持續營收增長, 作者翻開財報細看Operating income , 逐步分析US market, International和 AWS 佔比


1: 37 : 00  calculate present value of time , Time period  input 0.5 - 1.5 - 2.5 - 3.5
It's quite accurate way of doing present value calculation.

還有日期天數算法,  2022/6/12 ~ 2022/12/31 總共幾天, excel 加減符號計算出來


Excel OFFSET function

OFFSET Function in Excel: How to Use Offset Function in Excel

Excel OFFSET Function for Dynamic Calculations - Explained in Simple Steps

55 :00   OFFSET( Reference, rows, columns, hight, width )


1:02:00   calculate growth rate of EBIT based on  Conservative, street, Optimistic case

formula  M50 + (N51-M51)


建模進行A
fter EBIAT, 最後階段D&A估值採用過去5年平均法


Cash flow items  reference in numbers after 2022 all applied from 資料庫 Factset


1:23:10 EBIAT下面的 CaPEX  預設前三年 2022-2023-2024 Conservative case數值, 作者以Base case 前三年數值2022-2023-2024加上 0.5% 做預設, 同樣的, 預設前三年 2022-2023-2024 Optimistic case數值, 作者以Base case 前三年數值2022-2023-2024 減少 0.5% 做預設


2022年7月16日 星期六

Snowflake VS Databricks


Databricks is also cloud-based but is based on Apache Spark. Its management layer is built around Apache Spark’s distributed computing framework to make management of infrastructure easier. Databricks positions itself as a data lake rather than a data warehouse. Thus, the emphasis is more on use cases such as streaming, machine learning, and data science-based analytics.

Databricks can be used to handle raw unprocessed data in large volume. Databricks is delivered as SaaS and can run on AWS, Azure, and Google Cloud. There is a data plane as well as a control plane for backend services that delivers instant compute. Its query engine is said to offer high performance via a caching layer. Snowflake includes a storage layer while Databricks provides storage by running on top of AWS S3, Azure Blob Storage, and Google Cloud Storage.

For those wanting a top-class data warehouse, Snowflake wins. But for those needing more robust ELT, data science, and machine learning features, Databricks is the winner.


Snowflake vs. Databricks: Support and Ease of Use Comparison

The Snowflake data warehouse is said to be user-friendly, with an intuitive SQL interface that makes it easy to get set up and running. It also has plenty of automation features to facilitate ease of use. Auto-scaling and auto-suspend, for example, help in stopping and starting clusters during idle or peak periods. Clusters can be resized easily.

Databricks, too, has auto-scaling of clusters but it is not so user friendly. The UI is more complex as it is aimed at a technical audience. It requires more manual input when it comes to things like resizing clusters, updating configurations, or switching options. There is a steeper learning curve to overcome.

Both offer online support. Snowflake provides 24/7 live support while Databricks offers support during business hours.

Snowflake wins this category.


Snowflake vs. Databricks: Integration Comparison

Snowflake is on the AWS Marketplace but is not deeply embedded within the AWS ecosystem. In some cases, it can be challenging to pair Snowflake with other tools. But in other cases, Snowflake is wonderfully integrated. Apache Spark, IBM Cognos, Tableau, and Qlik are all fully integrated. Those using these tools will find analysis easy to accomplish.

Both tools support semi-structured and structured data. Databricks has more versatility in terms of supporting any format of data including unstructured data. Snowflake is adding support for unstructured data now, too.

Databricks wins this category.


Snowflake vs. Databricks: Conclusion


Snowflake and Databricks are both excellent data platforms for analysis purposes. Each has its pros and cons. Choosing the best platform for your business comes down to usage patterns, data volumes, workloads, and data strategies.

Snowflake is more suited for standard data transformation and analysis and for those users familiar with SQL. Databricks is more suited to streaming, ML, AI, and data science workloads courtesy of its Spark engine which enables use of multiple languages. Snowflake has been playing catchup on languages and recently added support for Python, Java, and Scala.

Some say Snowflake is better for interactive queries as it optimizes storage at the time of ingestion. It also excels at handling BI workloads, and the production of reports and dashboards. As a data warehouse, it offers good performance. Some users note, though, that it struggles when faced with huge data volumes as would be found with streaming workloads. On a straight competition on data warehousing capabilities, Snowflake wins.

But Databricks isn’t really a data warehouse at all. Its data platform is wider in scope with better capabilities than Snowflake for ELT, data science, and machine learning. Users store data in managed object storage of their choice and doesn’t get involved in its pricing. It focuses on the data lake and data processing. But it is squarely aimed at data scientists and highly capable analysts.

In summary, Databricks wins for a technical audience. Snowflake is highly accessible to technical and less technical user base. Databricks provides pretty much every data management feature offered by Snowflake and a lot more besides. But it isn’t easy to use, has a steep learning curve, and requires more maintenance. But it can address a much wider set of data workloads and languages. And those familiar with Apache Spark will tend to gravitate towards Databricks.

Snowflake is better set up for users that want to deploy a good data warehouse and analytics tool rapidly without bogging down in configurations, data science minutia, or manual setup. And this isn’t to say, either, that Snowflake is a light tool or for beginners. Far from it. But it isn’t high-end like Databricks, which is aimed more at complex data engineering, ETL, data science, and streaming workloads. Snowflake, in contrast, is a warehouse to store production data for analytics purposes. And it is good for beginners, too, and for those that want to start small and scale up gradually.

Pricing comes into the selection picture, of course. Sometimes Databricks will be much cheaper due to the way it allows users to take care of their own storage. But not always. Sometimes Snowflake will pan out cheaper.

2022年7月10日 星期日

開始算 Paypal 的 Market share ( 二 )


PayPal, eBay to stay interdependent for 5 years after split
April 10, 2015


5 years of interdepent each other - It give PYPL enough time to create the new channel of transaction charges in post- ebay period, to fill the gap possible without ebay covering


Initially, eBay didn't want anything to do with PayPal. The online marketplace had its own payment system, called Billpoint, which it developed with Wells Fargo. The home field advantage did little for Billpoint, which dissolved after eBay conceded the need to buy PayPal for $1.5 billion in mid-2002. At the time, eBay transactions made up about 60% of PayPal's gross payment volume.


Even under eBay's umbrella, PayPal saw a need to diversify. Over the next few years, PayPal aggressively pursued the business of off-eBay sellers, using new technology such as mobile payments to woo big brands. By the time eBay spun off PayPal in 2015, the so-called alternative payment provider was a common sight on checkout pages throughout e-commerce.


As PayPal has expanded into other markets and geographies, as well as other services such as PayPal Credit, its reliance on eBay for transaction volume has diminished. According to PayPal’s most recent earnings report, its business with eBay was up 10% in the fourth quarter of 2017, but as a percentage of overall volume it accounted for 13% of payments handled by PayPal, down 16% on the same quarter last year. PayPal categorizes this as “unbranded” payments, since it provides processing without displaying the PayPal brand

Block.In ( SQ ) 觀察


Q1 2021 Earnings Call

Question :

Thank you so much. Really impressive acceleration here. I wanted to ask if there's a way to maybe unpack that acceleration. I know reopenings probably played a role, stimulus probably played a role and maybe you're seeing some early returns on your stepped-up investments, Amrita, like you just mentioned there.

So is it possible to maybe unpack it that way? And I think it might help us think about the go forward as well. Thanks.


Answer :
With reopenings, I think you can see that most clearly in the stellar retention figures that we called out, we've been really encouraged here with the improvements that we've seen in recent months. When you look at GPV retention, existing cohorts of sellers have rebounded to around pre-pandemic levels. We're looking at that sort of two-year retention trend to normalize for the impact of COVID looking from '19 to '21. And in March and April of this year, GPV from our existing cohorts was nearly back to their 2019 levels.

Remember, this is a notable improvement from last year when the world was sort of discombobulated and our GPV retention was down about 40%. It improved to down 10% in the back half of last year, and we're now seeing back to very close to where they were in 2019, and on a gross-profit basis, actually seeing positive retention for the first time since the fourth quarter of 2019. So what we are seeing there, again, is very much due to both strength in reopenings, as well as strength in the new cohorts that we're bringing on. Our most recent cohorts from 2019 and '18 are showing better retention compared to older cohorts, we think, partly attributable to the greater mix of larger and more omnichannel sellers.

2022年7月7日 星期四

2022 Q3 Short crude oil 追蹤日記


木偶說謊 鼻子變長, 你這次空原油就是這樣....


操作靈感緣起

6/25 翻開WTI crude oil 52 week moving average線, 價位快要跌破半年支撐100塊, 計畫 short oil.  

操作策略 :

剛開始多空部位都建立( 怕近期油價反彈) 

情況一 : 在100塊附近止跌, 隨即反彈110 ~ 115 ,   你曾經想像空頭100%部位, 多頭50%部位, 假如油開始反彈 103 ~ 105 ~ 110塊, 你可以忍受空頭部位損失 ( 放屁啦 !! 👺👺  7/8 油期貨漲5%, SCO跌10%, 那天晚上你馬上後悔不該放掉50% bull position oil 等到oil price 漲超過110便開始衰竭無法漲, 你再 110 ~ 115附近開始加大放空, 加碼SCO, 看似完美計畫 ~ 


情況二 : 油在100塊附近徘徊1~2星期, 之後經濟數據公佈不如預期, 油直接摜破100, 跌到95塊加碼50% SCO, 跌到90塊 UCO先賣50%,  再跌到85塊, 再賣UCO50%. 假如跌到80塊先賣SCO50%, 繼續跌繼續賣掉剩下SCO部位, 交易結束 ( 跌破90塊後, 中間過程有反彈回漲, 看心理承受度適時買回UCO )


6/30 先分別建立SCO和 UCO 多空部位, 兩者金額一樣(部位Size差不多)


7/7 WTI crude oil盤中跌破100, UCO賣掉50%部位


7/8  油期貨漲了5.8%, 我的SCO跌10%, UCO漲10%問題部位昨天賣掉一半, 結果現在帳戶損失200塊, 心情受到影響( 因為自己想把帳戶損失控制在10%以內, 這次油再操作不利, 損失超過10% )

這樣好了, 假如明晚油再漲, UCO漲超到2.5%就回補50%部位, stop limit價格設明天開盤 +2.5%, , 鎖住損失.

8/1 油降到95塊, UCO 先賣掉一半

8/6 等了一個月, 油終於殺破90塊

8/8 油反彈超過90, UCO 回補一半

8/15 油降破90, UCO 賣掉2/3

8/22 油再度反彈超過90, UCO 1/3賣掉

8/22 ~ 8/30  油從90塊漲到98塊, 一度有反攻100塊以上之勢, SCO部位一度虧損, 心裡一橫 !! 咬著牙告訴自己, 就算原油反彈至120塊以上, 我就死抱不賣, 抱到明年很有可能再跌下來, 不賺不賠出場


9/7 皇天不負苦心人, 油短短2天從90殺到82塊, SCO 部位 + 16.9% 結清出場, 堪稱今年最成功一筆空單