去年2021.9月 保羅. 克魯曼仍覺得通膨不是個大問題, 如下述 :
名目工資的確有調升( 看圖中一行淺藍色地方)
也呼應剛剛新聞說法, 美國企業老闆的注意通膨可能持續, 多少會增加薪水, 另方面原因可能去年到現在2022Q1美國經濟仍有一些增長, 這反映在工資也會跟著增加一點點
但再看最上面一行紅色地方Real average hourly earnings實質每小時工資是逐月一點點減少, 這代表工資增長追不上物價上漲速度, 假如你今天薪水增加100塊, 結果小孩子尿布奶粉錢增加 200塊, 請問大家是否會少買 1~ 2袋(罐)尿布奶粉 -- 依這個邏輯推論一直到年底美國民間消費會變怎麼樣 ...........為什麼我會在2021. 5月此時盯美國實質工資率, 原因在此
以後想查實質工資率, google 美國勞工統計局
Average hourly earnings estimates are derived by dividing the estimated industry payroll by the corresponding paid hours有順便查到實質勞動成本 - 實質產出之間的差異變動, 狀況不大好 👇👇
另一方面, 之前Izzax在2021 H1曾說過商品消費會進入階段性尾聲, 接下來服務業消費接棒, 將延續美國經濟熱度, 我們直接來看圖, 到目前為止服務業表現 ( 經過通膨調整, Real Personal Consumption Expenditures )
Real average hourly earnings for all employees decreased 0.1 percent from March to April, seasonally adjusted, the U.S. Bureau of Labor Statistics reported today. This result stems from an increase of 0.3 percent in average hourly earnings combined with an increase of 0.3 percent in the Consumer Price Index for All Urban Consumers (CPI-U).
製造部門 月增0.2%
Real average hourly earnings for production and nonsupervisory 非管理職 employees increased 0.2 percent from March to April, seasonally adjusted. This result stems from a 0.4-percent increase in average hourly earnings combined with an increase of 0.2 percent in the Consumer Price Index for Urban Wage Earners and Clerical Workers (CPI-W).
製造部門 年減 -2.6%
Real average hourly earnings decreased 2.6 percent, seasonally adjusted, from April 2021 to April 2022. The change in real average hourly earnings combined with a decrease of 0.9 percent in the average workweek resulted in a 3.4-percent decrease in real average weekly earnings over this period.
Jason Furman (PIIE) and Wilson Powell III (Harvard Kennedy School)
January 28, 2022
WAGES HAVE GROWN IN SOME SECTORS BUT REMAIN BELOW TREND IN MOST
The growth of
wages has varied across industries, from a high of a 6.2 percent since December 2019 in leisure and hospitality to a low of a 2.6 percent annual
rate for utilities early 2022. In most sectors, however, faster inflation has resulted in
lower real wages and have left real wages below trend in all sectors (real
compensation is also below trend for all sectors). The pattern of wage growth
is a result of a number of idiosyncratic factors depending on the pace of
reopening and the supply of workers for different sectors, although there is
some indication that wage growth has been faster in lower-wage sectors.
FRED 資料
Table 2.2B. Wages and Salaries by Industry
Table 2.3.6. Real Personal Consumption Expenditures by Major Type of Product, Chained Dollars
Real Personal Consumption Expenditures by Major Type of Product, Monthly, Chained Dollars
Real Exports and Imports of Goods and Services by Type of Product, Chained Dollars
3月份美國美國蠆售銷售有微漲, 另一邊美國蠆售存貨月增率減緩( 好現象, 代表美國消費沒有減緩, 也支撐企業獲利 )
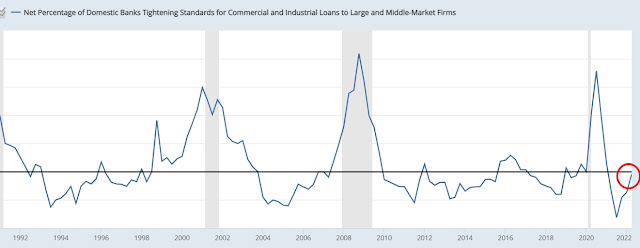
美國信用貸款指數開始走升, 可以看到自去年下半年美聯邦政府終止失業給付, 一堆Lower income group沒有收入來源, 開始向銀行申請信用貸款 ( 不確定這樣講邏輯ok ~ 因為低收入戶信用較差, 能否跟銀行貸的到錢 !? )
消費信貸會有助於支撐Q2 ~Q3 美國消費
預估一直到Q3, 美股仍走震盪格局


沒有留言:
張貼留言