https://www.sitkapacific.com/recent-letters/Sitka_Pacific_July-August_2020_Client_Letter.pdf
As the Fed’s zero percent interest rate policy and quantitative easing continued for years after the end of the Great Recession in 2009, the dip into negative real territory out on the long end of the Treasury yield curve in 2011 prompted a rush into gold — a rush which then came to a sudden end in 2013, during the market’s “Taper Tantrum.” During that tantrum, the real 10-Year Treasury yield quickly rose to positive 1% from negative 1% in just a few months, and gold fell alongside bond prices. Yet as sudden as the shift back to positive real rates was, the positive 1% level remained a ceiling for the real 10-Year Treasury rate while the bubble cycle in risk assets repeated a third time.( 不斷一次又一次發生) It remained below that level until its brief peek above it in late 2018. That brief rise above 1% was enough to cause the steep selloff in risk assets into the end of 2018 and bring a premature end to the Fed’s campaign to raise short-term interest rates.
金融海嘯過後2009 年公債殖利率進入短暫負利率時期( 大家搶著買公債), 間接造成其餘投資人去搶買黃金 ( 另一原因是中國大媽搶買 Gold) , 這波公債-黃金避險風潮在2013年劃下休止符, 之後市場先生從海嘯變臉時期過渡到Taper Tantrum( 偶爾發火)時期. 公債短暫幾個月就從 - 1%回升到+ 1%, 金價跟著滑落下來. 而殖利率 1%這個數字此後成為2010 -2018期間的一個天花板, 直到2018年底市場試探的將殖利率衝稍微高於 1%, 沒想到引發股票市場某些資金轉移性賣壓, 提前結束Fed調高短期利率的貨幣政策
The current downturn began with the lowest peak in the real 10-Year yield thus far, just 1.2%, and it was followed by the quickest crossover into negative territory. The fallout from the tech bubble never saw negative real interest rates, and it took four years for negative interest rates to appear after the housing bubble peak. This time, the real 10-Year Treasury yield dipped below zero within months after the cyclical peak, and the crossover into negative territory was cemented only a little more than a year after the peak. This progression of lower real rates since the year 2000 has been increasingly favorable for gold, fueling increasingly strong rallies. Yet despite the recent attention surrounding gold’s new nominal high, there are few signs today of any speculative fervor. Gold calmly walked through its 2011 high over the past few months, and it remains near the lowest value relative to the Fed’s expanding monetary base in its history, far below previous peaks in 1980 and 1933

2020.3月的大崩盤起始於2018底這歷史上最鳥的"殖利率高峰" -僅1.2%, 之後快速滑落到負利率. 2000網路泡沫時期沒見過負利率, 08次級房貸泡沫後經過4年(查證後大約3年)才發生過實質利率負的情況, 而這次2018年底的股市崩跌, 殖利率由正轉負僅僅花數個月, 且經過 1年2個月, 殖利率在0以下已變成一種常態, 短期間無法改變

Even among veteran investors with many decades of experience under their belt, there has been a palpable sense of something having become unmoored in the markets this year. Even as the global economy suffers through the largest disruption since the 1930s, risk asset prices have in many cases drifted back close to where they began the year, as if nothing economically significant has happened. And, in some areas, the markets appear downright optimistic. For example, the yield on BBB-rated bonds, which peaked above 10% during the financial crisis in 2008 and 2009, declined to a new all-time low of just 2.29% last month. The spread between junk bonds and Treasury bonds is also near historic lows.(這部分我查過, 歷史低點稍微誇大, 但spread的確從2020.3月回落很多) Apparently, the Fed’s backstop has erased the risk of any significant defaults in corporate junk bonds in the coming year, as would be expected during a typical recession
目前債利差已經從2020年3月高點回落很多, Fed 已經釋出大量資金, 盡全力防範企業高收益債在未來一兩年有 違約可能性

One of the main themes of our recent discussions of the 1960s and 1970s was the extent to which monetary policy progressed as if it was captive to the political and economic circumstances of the times. Again, and again, when the Fed faced the choice of preserving the long-term value of the dollar, or easing policy to buoy short-term economic and financial conditions, it chose to alleviate current conditions. Over time, there were two results of this captivity: a long-term trend lower in real, inflation-adjusted interest rates, and a massive devaluation of the dollar
在1960-1970年代 Fed 貨幣政策也是受限當時的政治經濟狀況而無法發揮全然獨立性
當Fed 面臨兩難抉擇: 要挽救美元貶值危機, 還是先紓解當前短期間政治經濟困境(就像目前要幫2020川普勝選) , 當時60年代也是選擇了後者, 先解決短期市場的波動, 而後導致最後的結果: 長期實質利率下跌 以及70年代初美元金本位制消失, 以及後來美元跟各國貨幣從固定匯率改變成浮動匯率
The devaluation of the dollar during the 1970s became the single largest factor affecting not only the market prices of financial assets, but the real returns investors received for holding those assets. Early on, as real interest rates began to trend lower in the late 1960s, risk asset markets were buoyed by the stimulus that lower interest rates provided; when real interest rates fall, the returns of other financial assets become all the more attractive if their rates of return do not fall as much or stay the same. These were the market conditions which spawned the speculative fervor over the Nifty Fifty
貶值的美元成為1970年代最大的經濟因素, 更稍早幾年前下降的利率導致資金成本低廉, 方便投資者容易借貸資金再投入到風險性資產(股票). 其他固定收益產品(債券類) 因為利率降低而變得不那麼吸引人
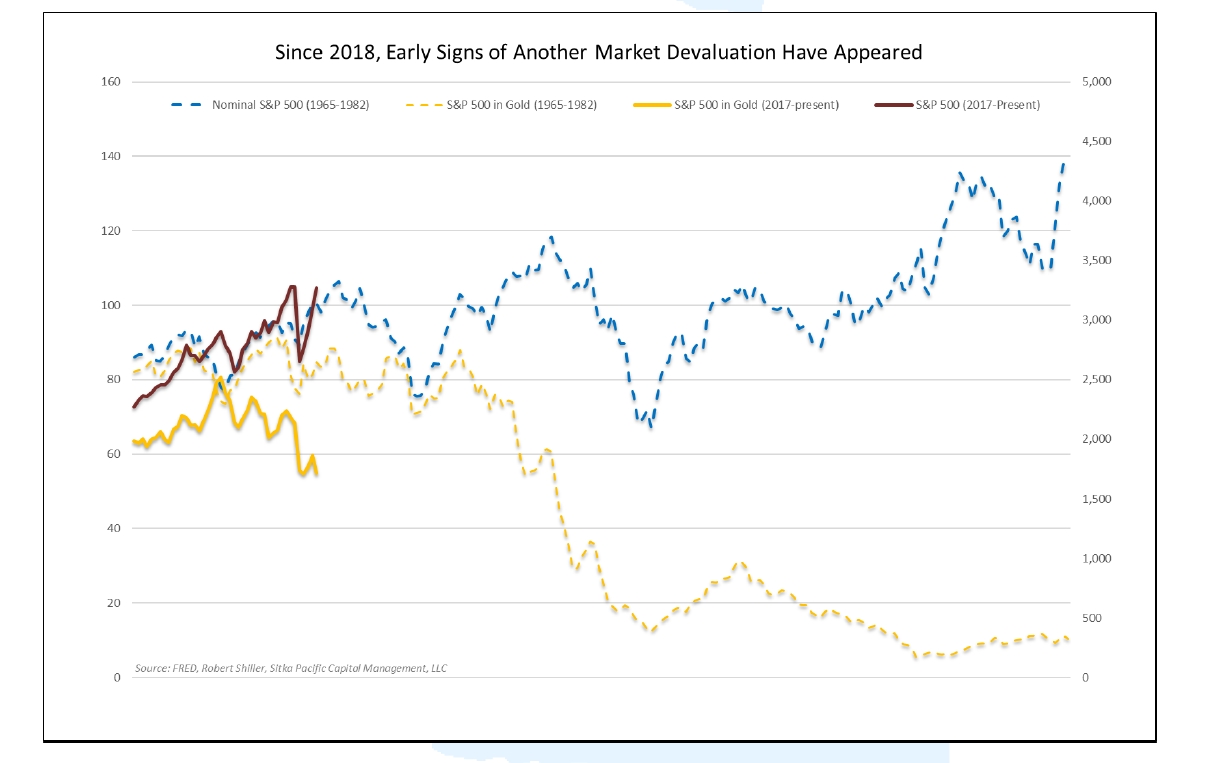
The growing exuberance among investors during those years resulted in a series of marginally higher nominal highs in the equity market in 1968, 1972 and 1973 as real interest rates fell, but underneath those higher highs was a growing disconnect between nominal prices and the real value they represented. This can be seen in the chart below, which shows the S&P 500’s nominal price (dashed blue line) and the S&P 500’s price in terms of gold (dashed gold line). These two prices of the S&P 500 began to diverge from one another once gold began trading higher in international markets than its statutory price in the late 1960s, and then they completely parted ways after 1971
股市分別在1968, 1972和1973創下波段高點, 歸功於低利率政策, 但股市的名目價格和真實價格(以黃金做衡量標準) 之間差距開始擴大, 尤其當1960末期黃金在國際市場開始熱烈交易而走高, 名目價格和真實價格走勢開始分道揚鑣.
The Nifty Fifty era ended the same way every other era in which a willingness to pay exorbitant valuations has ended. After the rush into that small group of popular growth stocks pushed the broader market to yet another new marginal high to begin 1973, it looked as if stocks were finally ready to burst higher in a new bull market after years of hesitation. Alan Greenspan, the future Fed chairman, reflected the prevailing mood when he confidently told the New York Times that month that “it is very rare that you can be unqualifiedly bullish as you can be now.”👶👶
市場後來也因為資產價格過高, 跟歷史上其他泡沫時期一樣, 最後崩跌下來. 許多資金衝進一些中小型成長股, 將股市推升到1973的一個階段性高點, 彷彿另一個大多頭即將產生. 當時候47歲 Alan Greenspan 年輕有為, 是備受看好的未來Fed主席人選, 新聞受訪也脫口而出" 接下隨之而來的大多頭, 你想不加入參一腳都很難 "👶👶
Instead of a burst higher, however, what began that very month was a rapid unwinding of the exuberance surrounding the Nifty Fifty, and the beginning of the equity market’s reckoning with the price inflation resulting from years of monetary expansion. Although lower real interest rates initially offered investors a justification for chasing stocks regardless of their valuation, the subsequent inflationary consequences of those lower real rates thoroughly eroded that justification after January 1973. A little less than a decade later, the broader market had sunk to its lowest cyclically adjusted valuation in 50 years.
後來市場沒有見到更高點, 取而代之的是短暫幾個月下跌, 市場開始針對自1965年以來Johnson的 Great Society產生龐大財政支出- 貨幣擴張, 所導致的通貨膨脹, 股市開始進行修正調整. 儘管低利率剛開始給予投資者一個很好藉口盲目追逐股票而不去正視其真正價值, 結果出不了幾年, 市場當時進行 50年來( 1920 -1970)最大規模系統性調整而整個崩下去
 |
| 1973 通貨膨脹失控 |

後論 : 感謝 Brain McAuley 這位經理人的努力, 抓出自1950年末期一直到1973年市場慘烈崩跌的一個回顧性調查 當時1971年美元正式脫離金本位制( 二次大戰後, 美元一度被認為等同於黃金), 這是一種優秀小學生突然期末考從100分跌到80分狀況, 所以當時市場一定會對這種現象做出反應( 股市自1966年高點開始摔) 但問題是50年後的 2020現在美元已經貶值好幾次了, 這位小學生從70年代以降繼續從考試80分, 跌到1987年60分, 再墮落到2008年的 40分. 上一次1970年長期熊市因為好學生成績優秀, 大家無法接受出現瑕疵, 50年後因為已經落到放牛班, 爛無可爛, 倒覺得這次市場未必還會來一次像1973年慘況
但有一種狀況大家就得小心, 未來5-10年(2020 - 2030) 美國的通膨是真的不能漲起來( 雖然目前各項數據顯示, 通膨可能性不高, Fed其實怕的是通縮) 目前10年公債殖利率 0.75 % , 假如未來通膨隨便漲個 1-2 %, 實質利率變負輕而易舉, 就算一般散戶想買美債, 你覺得那些機構投資人會買嗎 !! 他們為了追求收益率一定被迫資金轉向風險性資產( 股市-期貨- 大宗物資) , 這觀點請回看本文 as real interest rates began to trend lower in the late 1960s, risk asset markets were buoyed by the stimulus that lower interest rates provided; when real interest rates fall, the returns of other financial assets become all the more attractive if their rates of return do not fall as much or stay the same. 假如股市5-6年後真被衝高到不可思議地步, (尤其伴隨高通膨) 也請大家別管什麼艾略特波浪 第一階段(初升段) 第二階段( 主升段) 第三階段 ....... 先做好風險管理為上策👽 很多人以為度過2020.3月這一劫, 10年大週期終於過去, 周而復始, 萬物重生 @##$%
另外一點, 1970年代國際經濟大結構轉變( 美國製造業開始分批移轉至亞洲日本-南韓-台灣-香港) 加上1975年後通膨完全失控, 凱因斯財政政策正式掉漆, 失業率飆高 形成著名停滯性通膨 Stagflation, 這次2020未來美國失業率最佳幫兇, 就是近年討論不斷 AI 智慧取代人力
沒有留言:
張貼留言